WESTERN PRODUCER — Saskatchewan’s crops look better from the sky than they do from the ground.
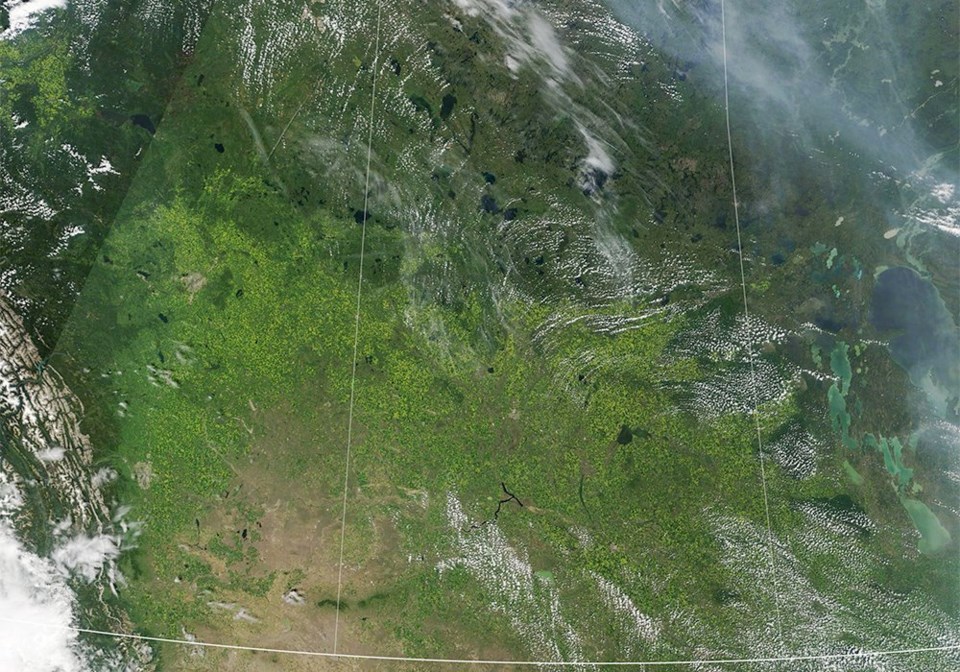
Statistics Canada used satellite-based vegetative growth maps to determine crop yields in its August principal field crop estimates report published on Sept. 14.
By contrast, Saskatchewan Agriculture used a boots-on-the-ground approach to determine yields as of Sept. 5.
The different methodologies resulted in a sizable discrepancy, with the federal government’s forecast being substantially higher than the province’s for nearly every crop.
For instance, Statistics Canada’s hard red spring wheat, durum and canola estimates were higher by 4.8, 6.0 and 3.8 bushels per acre respectively. Using the province’s seeded acreage estimates, that would result in an extra 1.09 million tonnes of hard red spring wheat, 794,366 tonnes of durum and 981,957 tonnes of canola.
Those are market-moving numbers.
Barley and flax are the only two crops where the federal and provincial governments appear to be in lockstep.
Matthew Struthers, crops extension specialist with Saskatchewan Agriculture, is confident in the yield estimates compiled from 200 crop reporters scattered across the province.
“We get our information from crop reporters, so we get it from people right on the ground,” he said. “They do a great job and I stand with the information we have in the report.”
John Seay, unit head for Statistics Canada’s crop reporting unit, is equally convinced about the accuracy of his numbers.
“We’re confident the model is doing a good job,” he said.
“The model is incorporating a very, very large volume of data in order to produce these estimates.”
It uses satellite-based vegetative growth maps and other administrative data sources to determine yields.
This is the seventh year in a row that the agency has used the model for its August report, replacing the traditional survey-based model.
“What we found from our own internal studies was that the model was able to produce estimates that were generally as good or better than what we were able to produce using the survey,” said Seay.
Gordon Reichert, senior scientific adviser with Statistics Canada, said the model also uses field-level data from Saskatchewan Crop Insurance.
That way they can use historical yields for a field in conjunction with the satellite data.
For instance, the agency has data on more than 14,000 lentil fields in the province.
“Is Sask Ag going out and sampling from 14,000 fields?” he wondered.
Statistics Canada’s lentil yield estimate is 188 pounds per acre higher than Saskatchewan Agriculture’s. That’s an extra 321,249 tonnes of the crop based on seeded acres.
Struthers acknowledged that the province’s system is not foolproof. For instance, there are not enough reporters to cover all of Saskatchewan’s 296 RMs.
“The ones that are blank or voided have to be filled using averages from around them,” he said.
But he believes the province does a bang-up job of weighting yields, placing more emphasis on RMs where there is a higher concentration of a certain crop.
In the case of lentils, that would be in west-central Saskatchewan, particularly in the Rosetown-Kindersley area.
“Last year, we saw some pretty horrific yields coming out of there and this year is no different for a lot of producers,” he said.
“It was another very, very tough year for a lot of people up there.”
That explains why Saskatchewan Agriculture’s overall lentil yield is 12 percent below the province’s 10-year average, while pea and chickpea yields are slightly above.
Kevin Hursh, who farms near Cabri in west-central Saskatchewan, said harvest was short but not sweet on his farm.
“All done but the crying,” he said. Yields were hugely disappointing.
“I’m south of Cabri. If you get north of Cabri people there might say it was just as bad or worse than it was last year,” said Hursh.
“I heard a story of somebody that combined five quarters of canola to fill a truck. It worked out to 1.2 bushels an acre.”
Seay stressed that the July and August reports are preliminary estimates. The final estimate will be the November report, scheduled for release on Dec. 2.
That report will be based solely on a survey of 27,000 farmers and will not rely at all on satellite imagery. It incorporates what transpired over the harvest months.
Struthers said time will tell which of the two approaches to estimating yields proved more accurate in 2022.
“When it’s all said and done, we’ll find out who’s right, I guess.”


